

Forecasters Gave Clinton Up to 99% in 2016. Polls Have Overrated Democrats Three Presidential Races Running
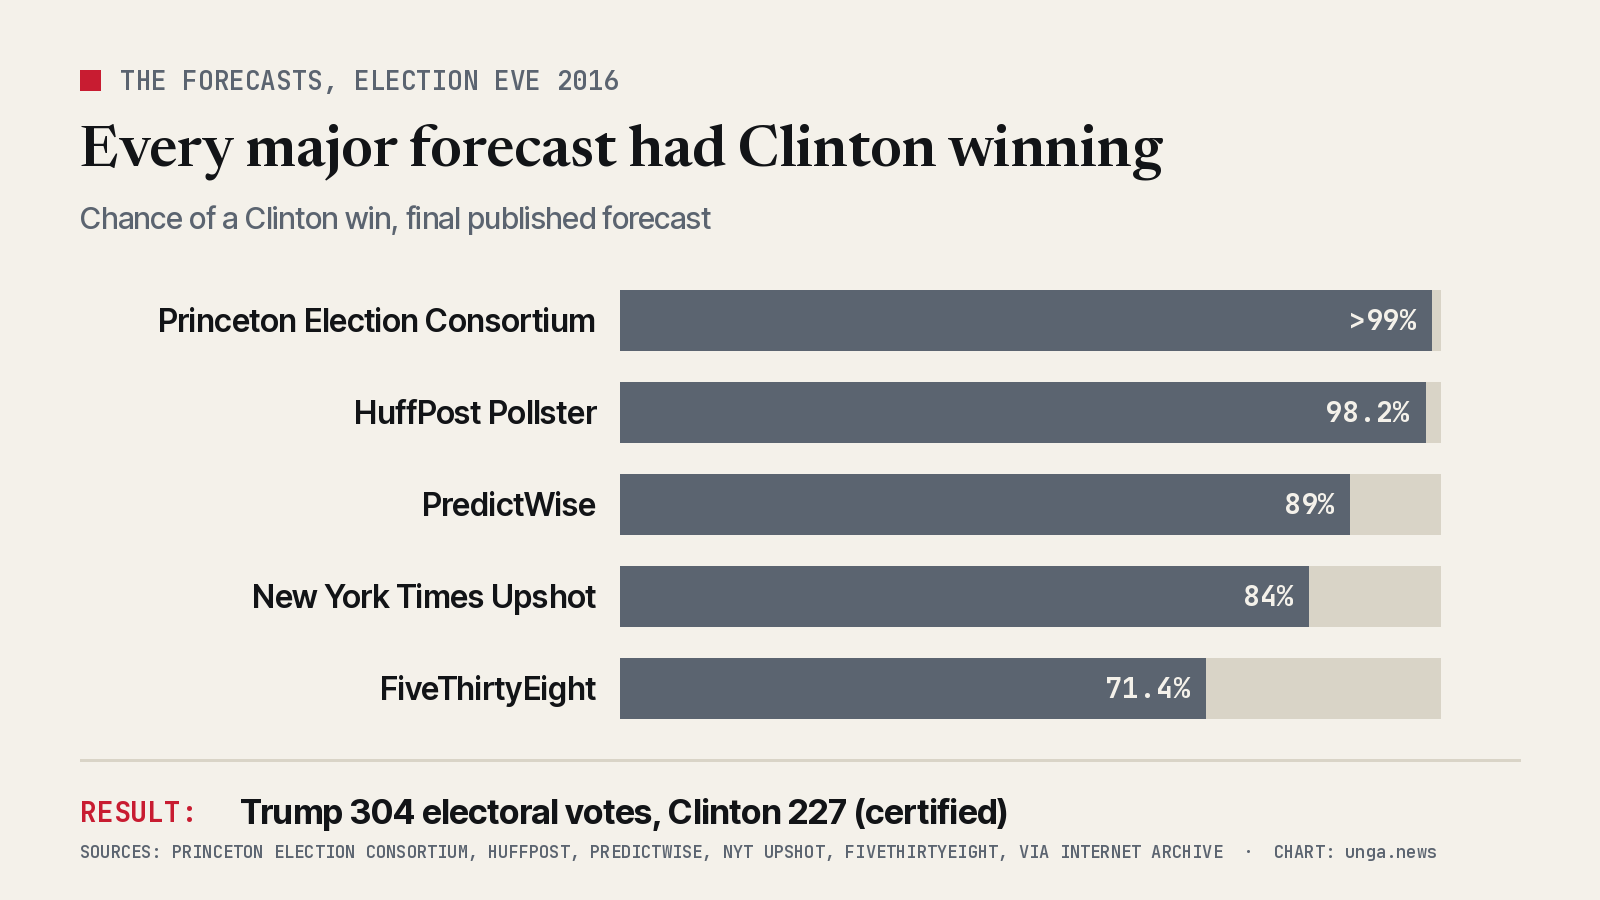
Princeton put Clinton above 99%, HuffPost at 98.2% and The New York Times at 84%. Trump won 304 electoral votes. The pollsters' own trade group says the misses ran toward Democrats again in 2020 and 2024.
Ten years ago, the experts were sure. Hillary Clinton was going to be president, and the only question was by how much.
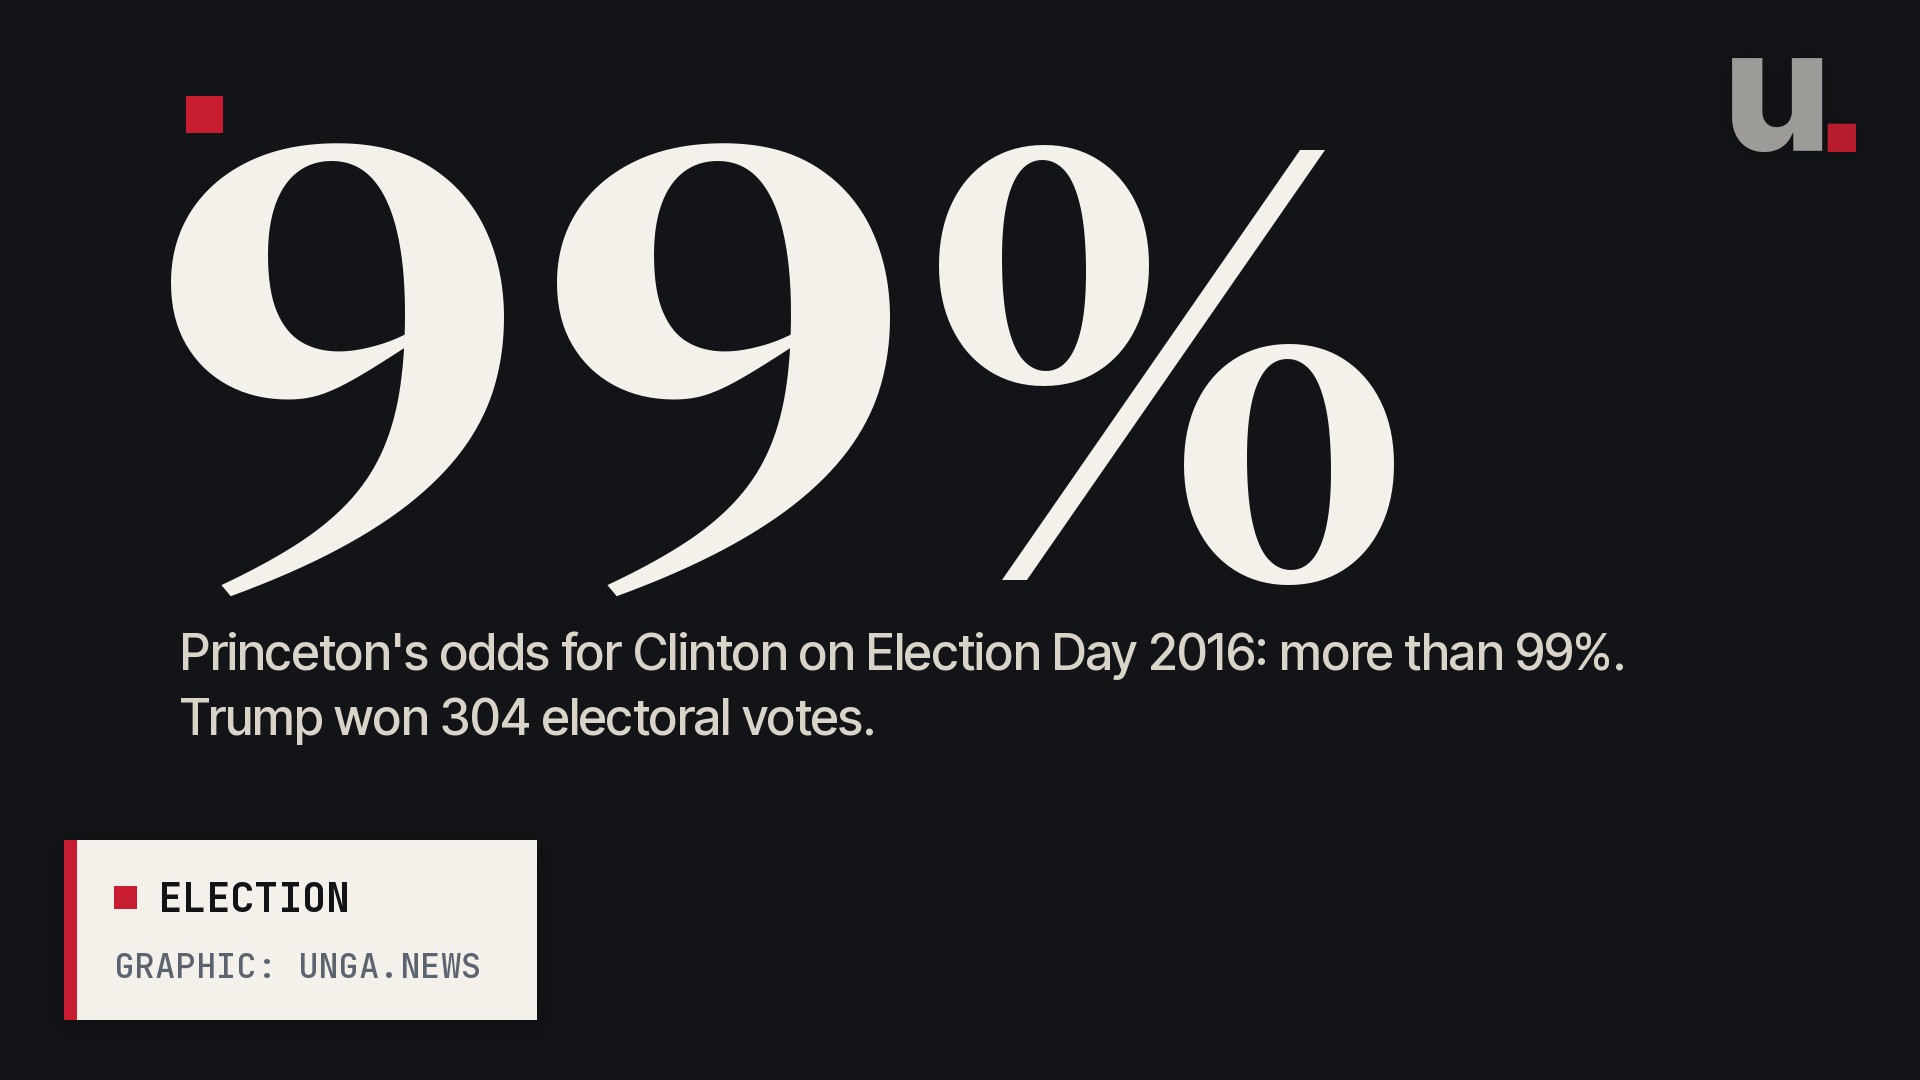
At 12:06 a.m. Eastern on Election Day 2016, the Princeton Election Consortium put Clinton's chance of winning at more than 99%. Its founder, Princeton professor Sam Wang, had already promised on Twitter in October: "It is totally over. If Trump wins more than 240 electoral votes, I will eat a bug."

Donald Trump won 304 electoral votes. Clinton got 227, according to the Federal Election Commission's certified count. Wang ate a cricket dipped in honey on CNN four days later.
He was not the outlier he is remembered as. Almost every big forecast got it wrong, and every one of them missed in the same direction.
The odds they gave Clinton
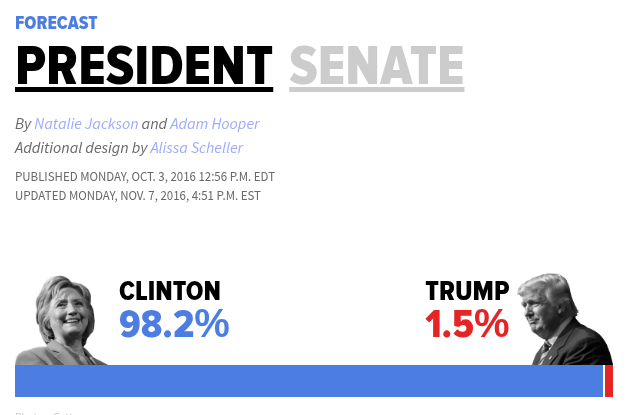
HuffPost's Pollster model ran 10 million simulated elections. In the update posted at 4:51 p.m. Eastern the day before the vote, Clinton won in 9.8 million of them, so HuffPost said she had a "98.2 percent chance of becoming president."
The betting-market site PredictWise said on election eve that Clinton was "89 percent to defeat" Trump, and 94% to win Pennsylvania. The New York Times Upshot had her at 84% at 3:58 a.m. on Election Day. FiveThirtyEight, the most cautious of the five, still gave her 71.4%.
The polls behind the odds
Those models ran on polls, and in October many of the polls showed a blowout. ABC News' tracking poll of Oct. 20-23 had Clinton up 50-38, a 12-point lead. AP-GfK had her up 14 on Oct. 20-24. Monmouth had her up 12 in mid-October. All three are in RealClearPolitics' archived poll list.
Clinton won the popular vote by 2.1 points, 48.18% to 46.09%. The final national averages were closer to that than the headline polls: RealClearPolitics had Clinton up 3.3 in the four-way race on Election Day.
The race was decided in the states, and there the polls were worse.
The blue wall that wasn't
RealClearPolitics' final average had Clinton up 6.5 points in Wisconsin. The Marquette Law School poll had her up 6 in its final survey, Oct. 26-31. Trump won Wisconsin by 22,748 votes.
In Michigan, the final average had Clinton up 3.6. Trump won by 10,704 votes. In Pennsylvania, the Election Day average had her up 2.1, and a CNN/ORC poll a week out had her up 5. Trump won by 44,292 votes.
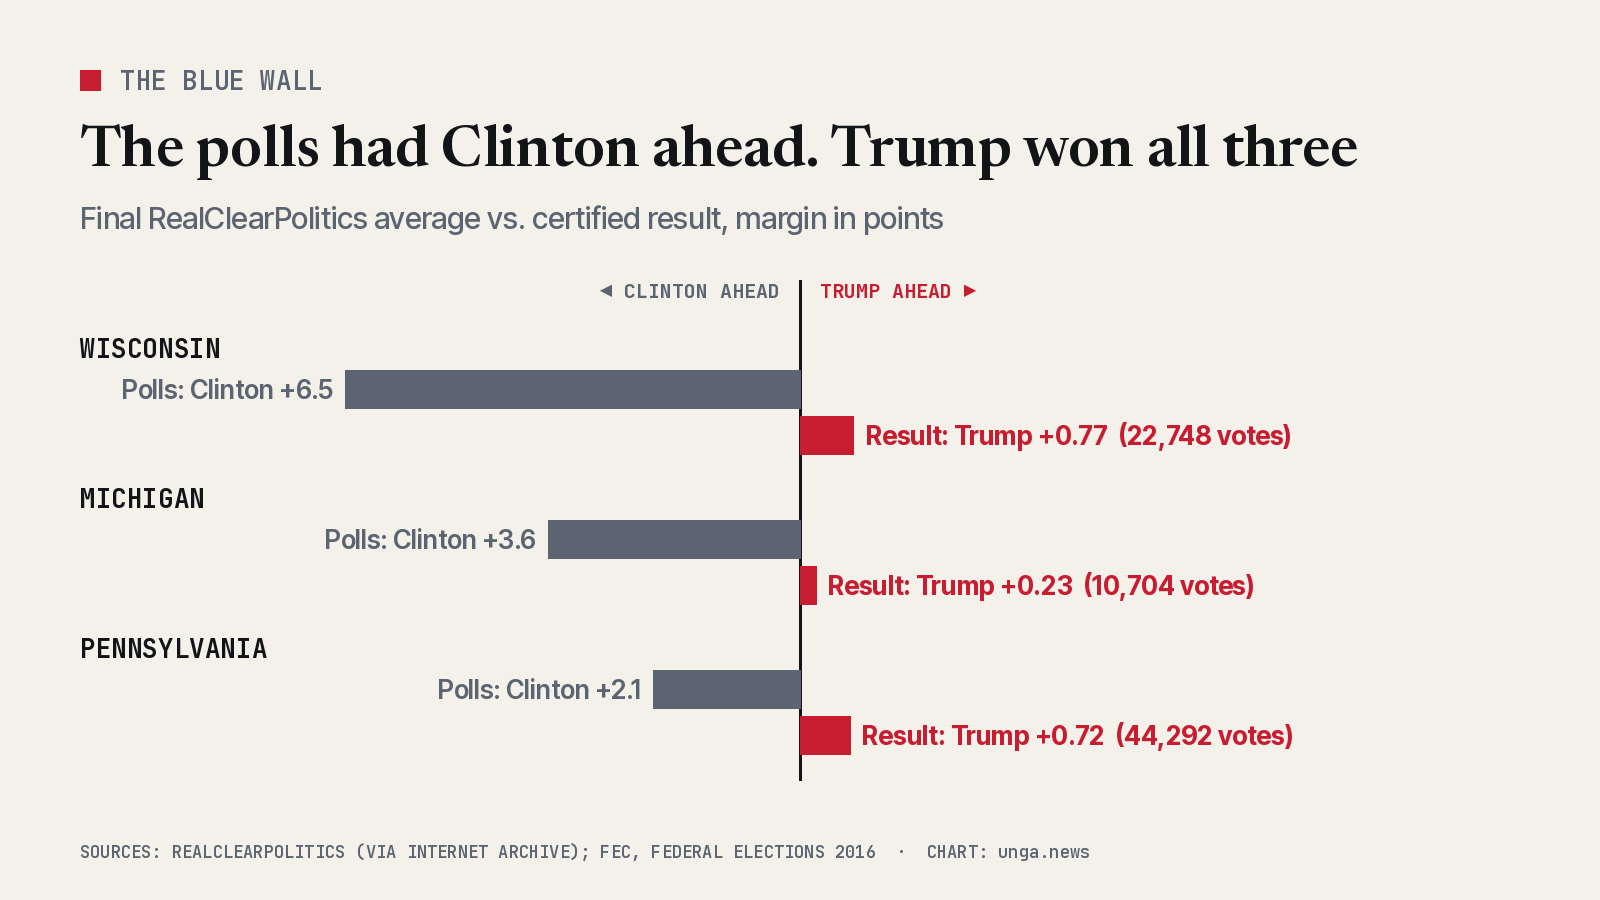
Those three states carry 46 electoral votes, and AAPOR noted they had voted Democratic for president six elections running. Trump won them by a combined 77,744 votes.
What the pollsters admitted
In 2017, the pollsters' own trade group, the American Association for Public Opinion Research, published its post-mortem. It found state polls were off by an average of 5.1 points, with a signed error of 3.0 points "in the direction of over-estimating support for Clinton."
AAPOR named the main causes. Many state polls "did not adjust their weights to correct for the over-representation of college graduates," who leaned toward Clinton, "and the result was over-estimation of support for Clinton." Late deciders broke for Trump by nearly 30 points in Wisconsin and 17 points in Florida and Pennsylvania. And some Trump voters in pre-election polls "did not reveal themselves as Trump voters until after the election."
AAPOR also wrote that the direction of poll misses, from one election to the next, "is tantamount to a coin flip."
Then it happened again, twice
Four years later, the coin landed the same way. AAPOR's 2020 task force found the polls had "error of an unusual magnitude," the highest in 40 years for the national popular vote, and that the error "was much more likely to favor Biden over Trump." National polls overstated Biden's margin by 3.9 points and state polls by 4.3. In Senate and governor races, polls were 6.0 points too favorable to Democrats.
In 2024, the polls were closer, and Trump won anyway. AAPOR's newest report, published in October 2025, says: "For the third straight presidential cycle, pre-election polls underestimated Republican vote shares relative to Democrats'." Final-two-week polls overstated Democratic margins by 2.7 points across all offices, after 4.6 points in 2020 and 3.1 in 2016.
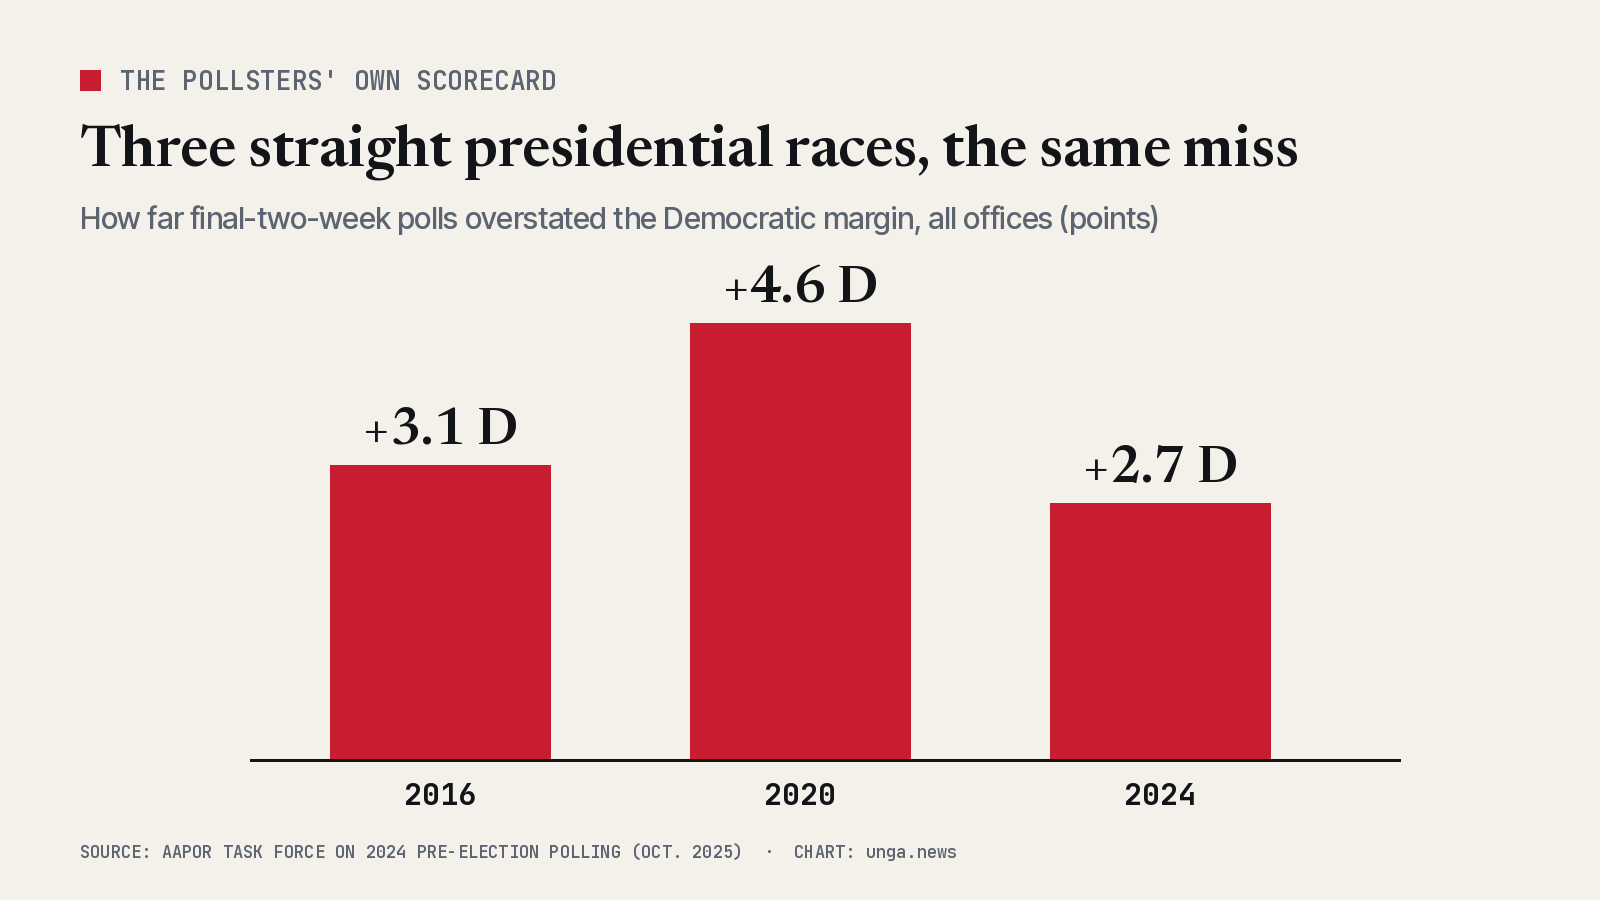
AAPOR blames methods, such as who agrees to answer polls, rather than pollsters picking sides. It also notes that midterm polls were close in 2018 and 2022. But the record of the last three presidential races is in its own reports: every time, Republicans did better than the polls said.
Before Tuesday
The midterms are Nov. 3. Expect a final wave of polls, and expect them to be treated as results.
In 2016, the polls said Clinton. The forecasters said 71% to more than 99%. The voters said Trump. Polls don't vote. You do.
Sources
- Princeton Election Consortium (via Internet Archive) — Home page as of Nov. 8, 2016, 12:06 a.m. EST: Clinton win probability >99%
- HuffPost (via Internet Archive) — 2016 Forecast: President, updated Nov. 7, 2016: Clinton 98.2%
- The New York Times (via Internet Archive) — The Upshot: Who Will Be President? Clinton 84%, Nov. 8, 2016
- FiveThirtyEight (via Internet Archive) — 2016 Election Forecast: Clinton 71.4%, Nov. 8, 2016
- PredictWise (via Internet Archive) — Election Eve 2016: Clinton 89 percent
- RealClearPolitics (via Internet Archive) — 2016 General Election: Trump vs. Clinton vs. Johnson vs. Stein, polls and average, Nov. 8, 2016
- RealClearPolitics (via Internet Archive) — 2016 General Election: Trump vs. Clinton, poll list, Nov. 7, 2016
- RealClearPolitics (via Internet Archive) — Wisconsin: Trump vs. Clinton, final average Clinton +6.5
- RealClearPolitics (via Internet Archive) — Michigan: Trump vs. Clinton, final average Clinton +3.6
- RealClearPolitics (via Internet Archive) — Pennsylvania: Trump vs. Clinton, Election Day average Clinton +2.1
- Federal Election Commission — Federal Elections 2016: certified presidential results
- AAPOR — An Evaluation of 2016 Election Polls in the U.S. (2017)
- AAPOR — Task Force on 2020 Pre-Election Polling: An Evaluation of the 2020 General Election Polls
- AAPOR — Task Force on 2024 Pre-Election Polling: Executive Summary (Oct. 2025)
- Caltech Alumni Association — Why I Ate a Bug: Q&A with Sam Wang