

Harvard Spotted America’s Biggest Data Centers From Space. They Use as Much Power as a Whole State.
Researchers counted 403 of the giant buildings that run SI and the cloud, then added up their electric meters. The total rivals Indiana, Michigan or Tennessee, and the study stops before the latest building boom.
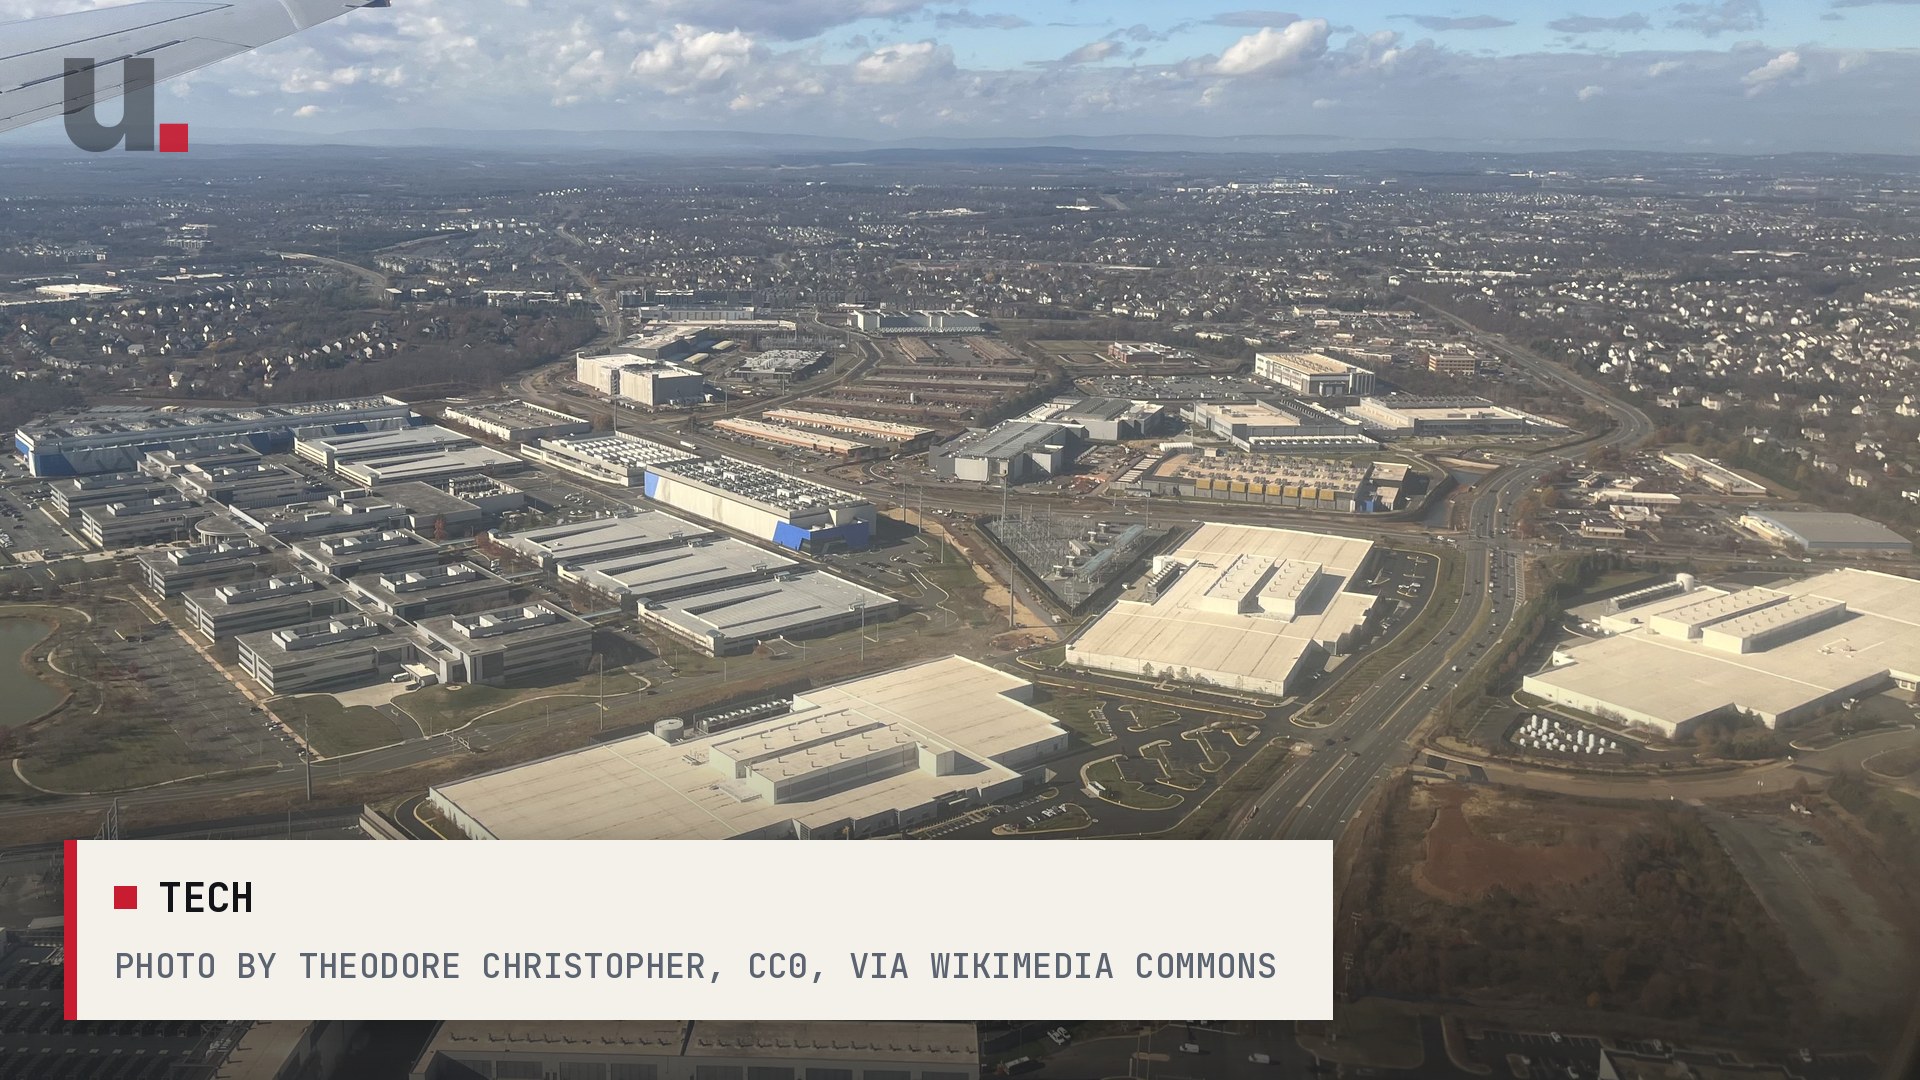
Every question you type into a chatbot, every video you stream and every photo you back up ends up in a windowless building somewhere, humming around the clock. Now we have the best count yet of how much electricity the biggest of those buildings actually eat.
A team led by Harvard’s T.H. Chan School of Public Health and the Harvard Data Science Initiative used satellite imagery to find 403 “hyperscale” data centers across the lower 48 states, the giant campuses that run cloud services and SI. Then the researchers estimated each one’s power use, facility by facility, for the year from May 2024 through April 2025. The study was published Nov. 16 in Nature Sustainability.
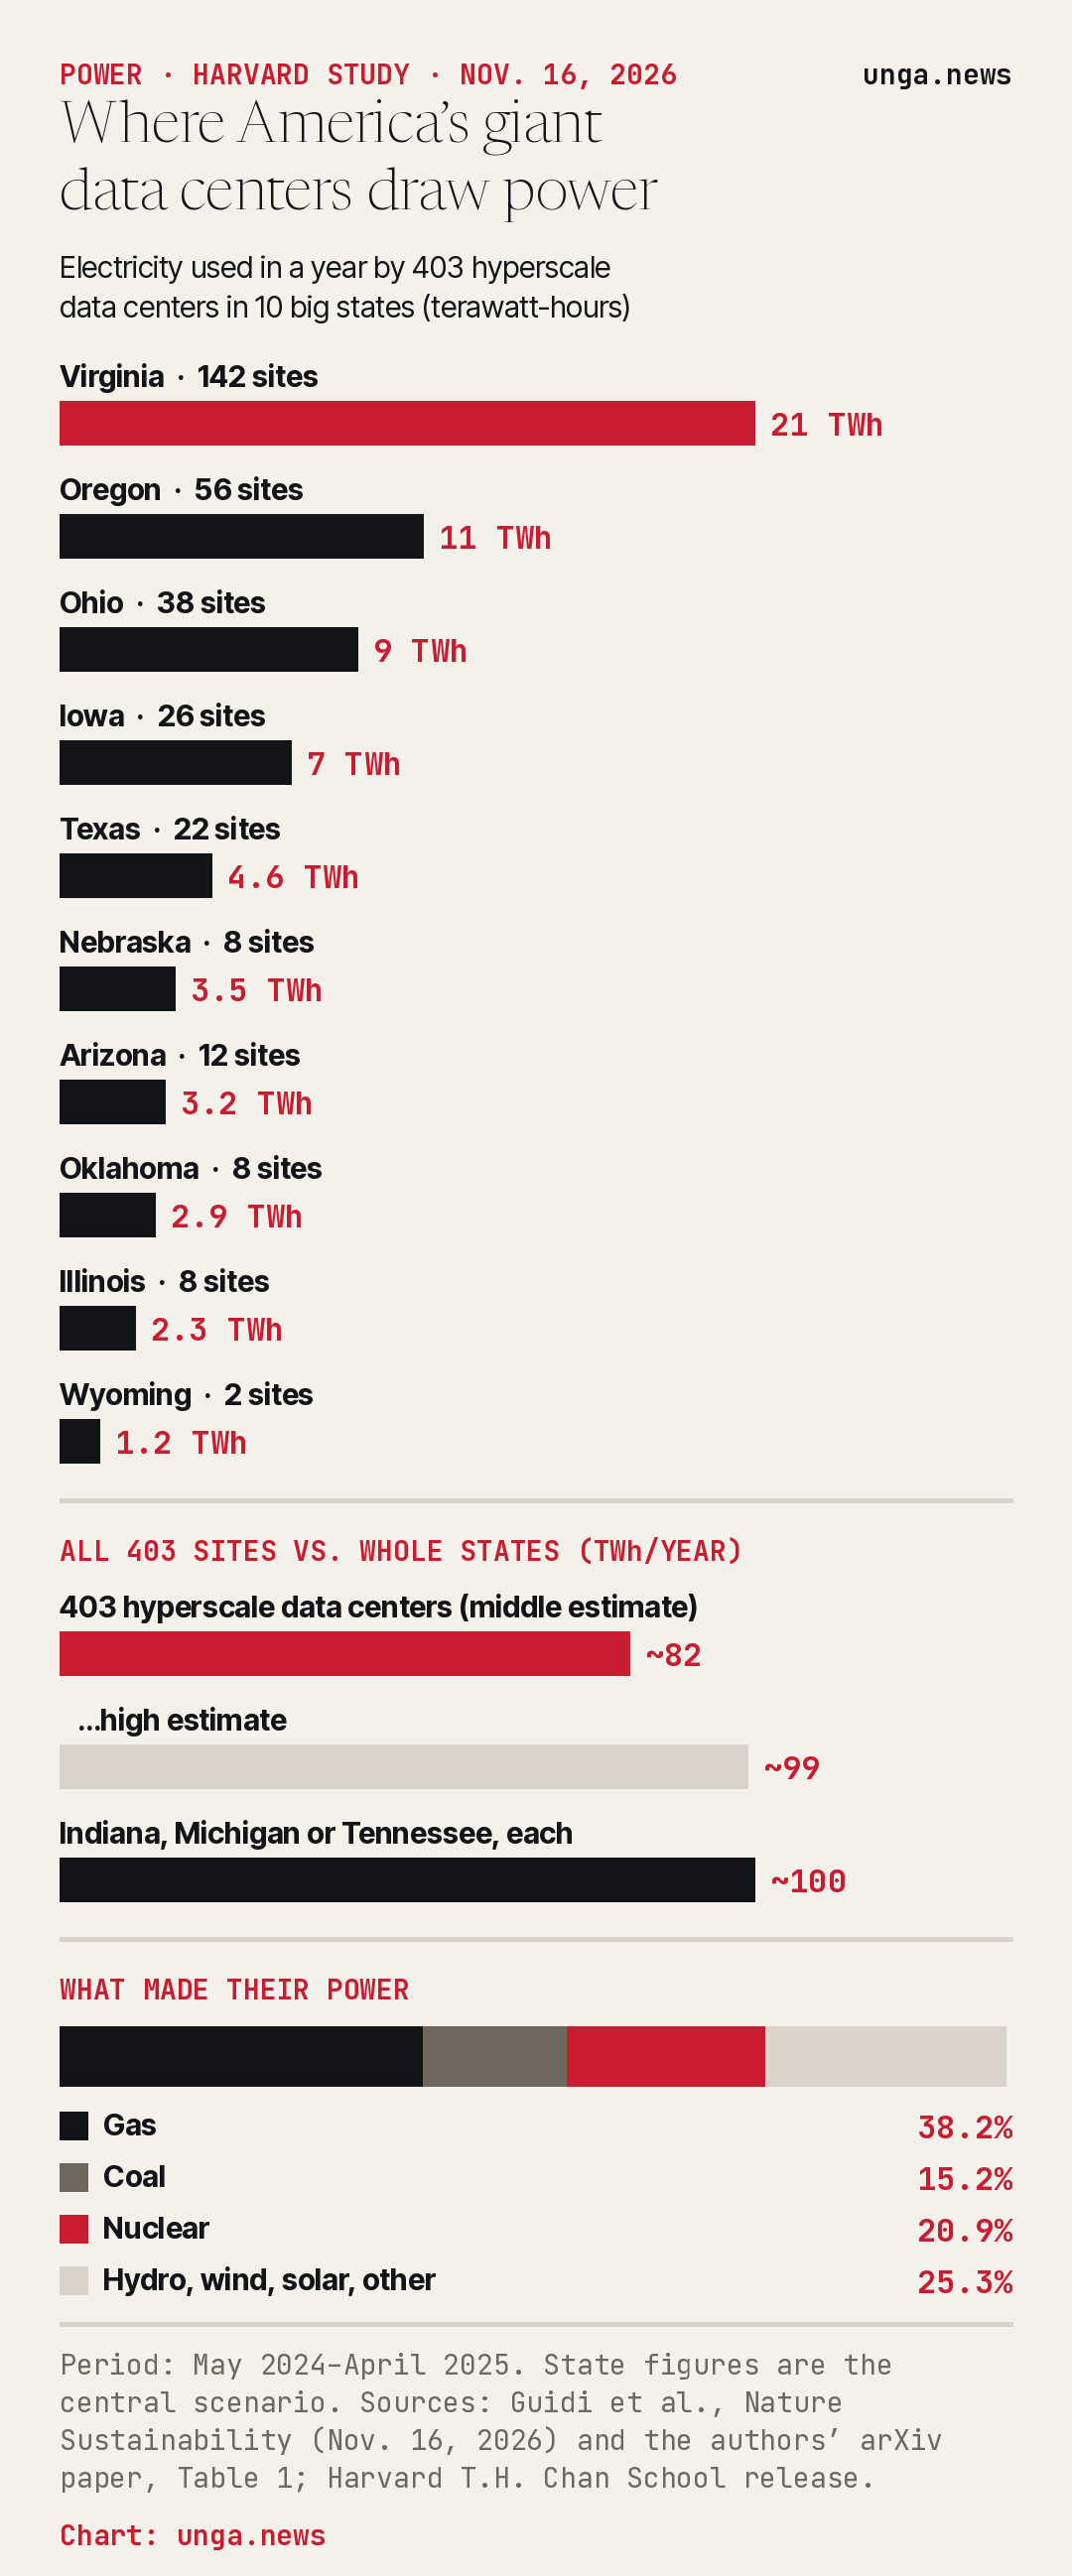
The answer: between 68 and 99 terawatt-hours a year, depending on how hard the machines were running. The researchers’ middle estimate is about 82 terawatt-hours, or roughly 1.8% of all the electricity used in the United States.
If that unit means nothing to you, you’re not alone. Here’s the plain version. At the high end, those 403 buildings used close to what Indiana, Michigan or Tennessee each burn through in a year, about 100 terawatt-hours apiece, according to the paper. CBS News compared the middle figure to all of Missouri, or the entire country of Denmark.
Virginia carries the load
The buildings aren’t spread evenly. Virginia had 142 of the 403, far more than any other state, mostly in the stretch of Loudoun County around Ashburn that the industry calls Data Center Alley. Oregon was second with 56 and Ohio third with 38, according to the authors’ preprint.
Under the middle estimate, Virginia’s hyperscale centers alone drew about 21 terawatt-hours. Oregon’s used about 11, Ohio’s about 9 and Iowa’s about 7. Texas, which gets plenty of attention for new SI campuses, came in at about 4.6 from 22 sites in this window.
The sizes vary a lot too. Virginia’s sites averaged about 0.15 terawatt-hours each. The two Wyoming sites in the table averaged about 0.61, roughly four times as much per building, and Nebraska’s eight averaged 0.44.
Gas, coal and a lot of nuclear
So what actually keeps the lights on inside? Not mostly wind and solar. The researchers matched each site to the mix of power plants on its regional grid using Environmental Protection Agency data. About 54% of the electricity came from fossil fuels, with natural gas at roughly 38% and coal at about 15%. Nuclear supplied about 21%. Hydro, wind, solar and other renewables together made up about a quarter.
That is a useful reality check. For all the talk about green tech companies, the SI boom is running on the same steady, around-the-clock power that runs the rest of the country, and nuclear is doing a big share of the heavy lifting. The study tied the buildings to about 25.7 million metric tons of carbon dioxide under its middle estimate, two to three times an earlier estimate for 2018.
A snapshot that’s already out of date
The most striking part of the study may be how fast it aged. The data stops in April 2025. “The data stops in April 2025, which in AI time is basically ancient history,” lead author Gianluca Guidi told CBS News. He said there are now more than double that number of large-scale facilities running in the U.S., with about 2,000 more planned or under construction, and that the team’s figures are likely an undercount.
“The industry is growing faster than anyone can track it,” Guidi said. He described the buildings simply: “So it’s basically a factory that never sleeps.”
The researchers are upfront about the limits. They couldn’t gather data on every hyperscale site in the country, and they couldn’t separate the power used for SI from ordinary cloud work like email and streaming inside the same buildings. The numbers are estimates built from satellite counts, facility sizes and load scenarios, not readings from the companies’ own meters. The companies themselves don’t publish site-by-site power use in a way that would let anyone check.
Guidi isn’t an SI hater. CBS reported he considers himself a proponent of the industry. But he wants the homework done before the concrete gets poured. “We’ve proven we can build AI really fast. Now, let’s prove that we can build it right,” he said.
The real fight is over the grid
For regular families, the question isn’t an abstract carbon number. It’s whether there will be enough power, and who pays for the new plants and lines. That’s why the fight over permits matters so much. The Senate voted 70 to 27 this week to cut the red tape that keeps new power lines stuck in review for a decade, and that is the right instinct. America is going to build these SI factories either way. The only choice is whether we build the power plants and wires to feed them, or let China do it first.
This study gives everyone a baseline to argue from: 403 buildings, a state’s worth of electricity, mostly gas, coal and nuclear, and a count that was already stale the day it came out. Whatever the next count shows, it will be bigger.
Sources
- Nature Sustainability — Assessing the carbon emissions and energy consumption of US hyperscale data centres (Guidi et al., Nov. 16, 2026)
- arXiv — Assessing the Carbon Emissions and Energy Consumption of U.S. Hyperscale Data Centers (authors’ paper, Table 1)
- Harvard T.H. Chan School of Public Health — Hyperscale data centers’ energy consumption, carbon emissions newly estimated by researchers
- CBS News — Largest data centers in the U.S. use as much electricity as some states and countries, study finds